
In reflecting on the work accomplished in 2025, Performance under Adversity (PuA) comes out on top as one of the things I'm most proud of, and find most useful on a daily basis.
At AWS re:Invent recently, I found that I turned to PuA anytime someone wanted more detail about what we do and why it matters. This post is inspired by my booth conversations and walks through my "pitch", if you will, using PuA to help people understand distributed SQL resilience.
The Problem
Performance under Adversity came about because we were faced with a problem.
Our number one value proposition is resilience, yet we (as an industry) don't have a good – meaning fair and consistent – way to quantify resilience. We measure performance... but that's usually an ideal state. Ideal isn't real. In the real world, when operating at scale there's always something not quite working the way it was meant to be.
We asked ourselves:
How do you measure performance in the real world, when there's always something not quite right?
The result has become one of my favorite ways to talk about CockroachDB to people who don't know much of anything about who we are or what we do.
The Benchmark
Performance under Adversity defines six failure states in increasing severity plus steady-state operations (so, seven states in total) and measures throughput and latency for each of these failure states:
- Baseline performance. This is how everything works once it reaches a steady state with no failures.
- Internal operational stress. Here we start to introduce normal administrative activities like backups, change feeds, online schema changes, and an online update. Admission Control ensures these background operations do not impact foreground database operations. This should give administrators the confidence that these online operations, unique to distributed SQL, can run without incurring planned database downtime.
- Disk stalls. Common in cloud implementations, disk stalls are grey failures that impact performance due of ephemeral delays introduced when writing to the disk. In v24.3 we introduced WAL Failover to improve performance in just these scenarios and it appears to be doing the job it's supposed to be doing!
- Network failures. Now we start to get into some of the more severe failure situations with asymmetric and symmetric network failures. You can see the results of each, with the first purple dot representing an asymmetric failure and the second a complete network failure.
- Node restarts. In this failure scenario with take down nodes both gracefully, allowing the node to drain, and less-gracefully (just pulling the plug). In both cases there's almost no impact to throughput or latency.
- Zone outages. Where we remove an entire zone from the database, causing a small spike in latency of short duration.
- Regional outages. And, finally, where we remove an entire region from the database, causing a similar latency spike of slightly longer duration, but still almost no impact to database performance.
And, here are the latest multi-region results (click to visit the dashboard):
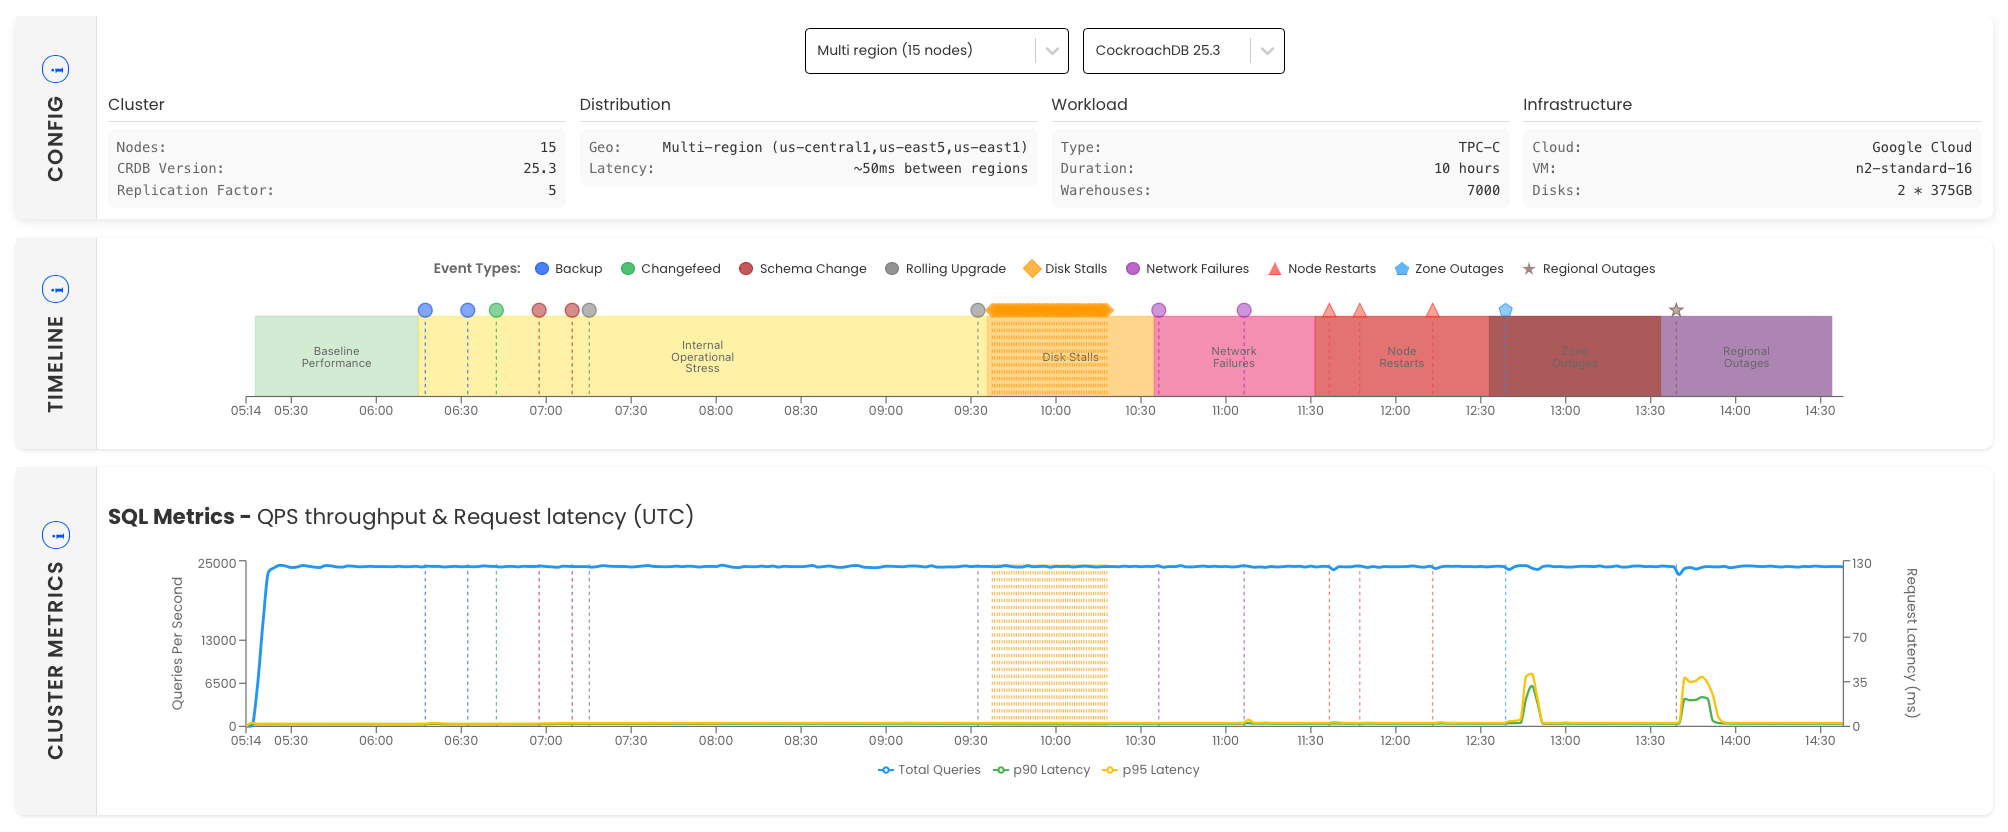
You'll notice that the blue line stays consistent, meaning throughput remains consistent, regardless of the failure state. Latency also, for the most part, remains unchanged, except for the most severe failures, where there's a small latency blip as the database adapts to the failure.
And, I like to point out the work the engineering team did between 25.1 and 25.3 to reduce latency by 90% - reducing it from ~21ms to ~2ms in the steady state. It's a testament to the old adage, you can't improve what you don't measure. (You can see this on the dashboard by using the drop-down field at the top to select which version of CockroachDB you'd like PuA results for.)
Now that we're regularly measuring resilience, we're able to measurably improve the system response to failures.
More Information
A colleague has written three solid LinkedIn posts on PuA covering some of the things he's seen in the field:
There are also three blog posts on the Cockroach Labs blog that are useful to read (and share!):
- CockroachDB Redefines Database Performance with Real-World Testing. A summary of our drivers and approach for this effort written when we first launched PuA.
- Ideal isn’t real: Stress testing CockroachDB’s resilience. An engineering blog post on the methodology and effort that went into creating and delivering the benchmark.
- Ideal Isn't Real, But Improvement Is: CockroachDB's Resilience Enhanced in 25.2. An interesting engineering oriented post, with performance numbers, that shows how we're using PuA internally to drive development teams to improve their resilience deliverables and to benchmark improvements from release-to-release. 25.2 delivered significant resilience and performance improvements, and you can learn more about them in this post.
The first post above contains a great, short (under 5 minute) video talking through PuA that's worth watching, even if you don't want to read anything else about PuA:
There's also the landing page that has a lot of useful information, including:
- A link to an interactive dashboard where you can explore the results.
- An ungated user guide to understand the metrics and testing methodology.
- A gated benchmark setup guide, for those who want to repeat the benchmark in their own environment.
Spin up your first CockroachDB Cloud cluster in minutes. Start with $400 in free credits.